
The Agatha Christie Formula was a project I completed for a class during Spring 2017. Agatha Christie is an infamous 20th century author of dozens of murder mysteries, and one of the best-selling authors of all time. Because she wrote all of her novels within the constraint of the murder mystery sub-genre, her novels are often described as being formulaic – someone is murdered, the detective arrives, they search for clues, rule out possibilities, and reveal the identity of the murderer at the end of the novel.
Methods
I decided to put this statement to the test. If that plot formula exists, I should be able to find and graph its trajectory across a standard Christie novel. My method was as follows:
- After reading several Christie novels and reading about what others perceive to be the Christie formula, I identified 6 key plot points that should occur in every novel. They are:
- The murder
- Introduction to the detective
- Introduction to the murderer (obviously, before we know they’re the murderer)
- Introduction to the victim (i.e. the victim never remains anonymous)
- The “gathering” – this is a classic Christie move. At the end of the novel the detective always gathers together the cast of characters for a dramatic declaration that they have solved the mystery and are about to reveal the identity of the murderer. Often, the murderer is among those who have gathered.
- The reveal
- Christie wrote 66 novels during her lifetime, but I decided to focus only on her two most famous series – the Hercule Poirot series and the Miss Marple series. Poirot and Marple are two detectives who have recurring roles in Christie’s novels. I used most of the novels from each series; a few had to be omitted because they were so obsolete that I wasn’t able to easily acquire a copy of them. I ended up with just under 40 novels.
- For every novel, I identified as accurately as possible where each of the 6 plot point occurred. I made note of the percentage of the way through the novel that each point occurred.
- Finally, I graphed the results as a simple line graph with the plot points in the most common order they occur on the y-axis and the percentage of the way through the novel on the x-axis.
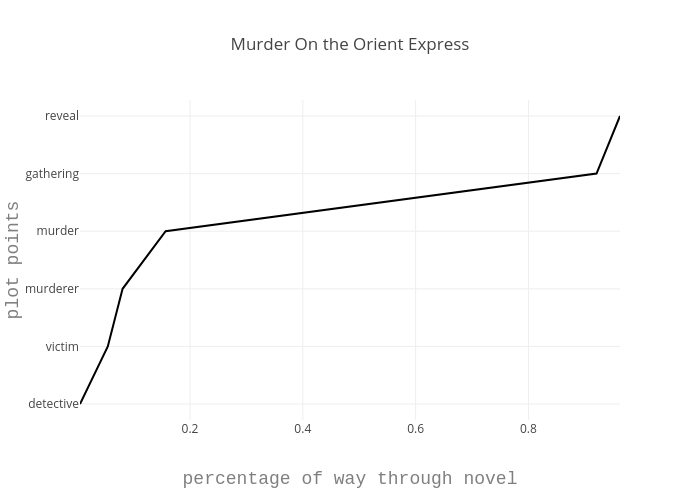
How to read the graph: Let’s consider a single text, Murder On the Orient Express, as an example. Below is the graph for this novel. It follows the most common structure for Christie’s mysteries. The detective, Poirot in this case, is introduced at the very beginning of the novel, so the “detective” point is plotted at (0, 0). The victim is introduced shortly after Poirot, and is plotted at approximately (0.05, 1), or 5% of the way into the novel. Note that the reader does not know at this point that this character is the victim because the murder has not yet occurred. About 8% of the way into the novel, the murderer is introduced.*(SPOILER ALERT) At 16% of the way into the novel the murder occurs, and at 93% Poirot gathers together the cast of characters for his big reveal at the very end of the novel.
The Graphs
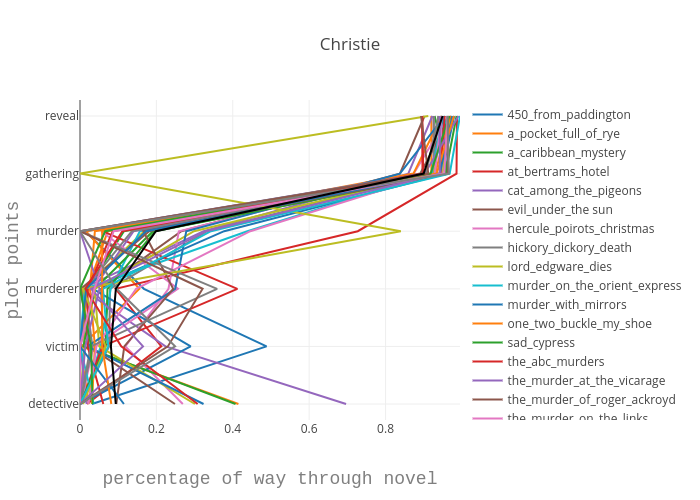
Here’s a preview of the graph for all of the novels I included in this project. You can click on the image to open an interactive and more accessible view. In the accessible view, click on individual titles from the list on the right to turn those titles on/off in the graph, or double click a title to display only that title.
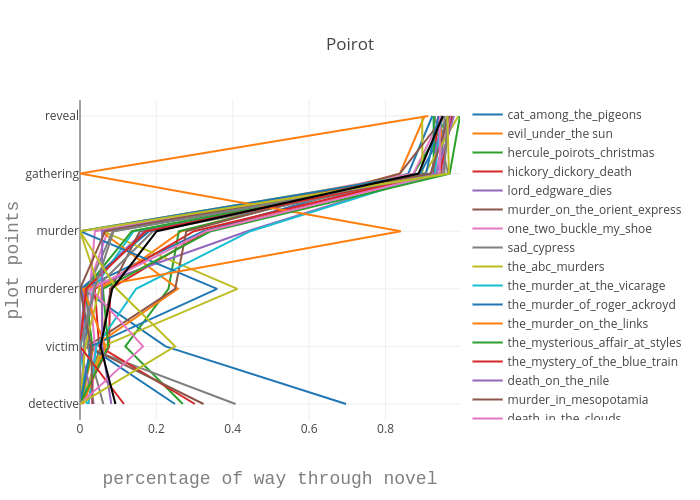
I quickly realized that it was valuable to look at the novels for an individual detective series by themselves. The following is the graph of just the Poirot novels:
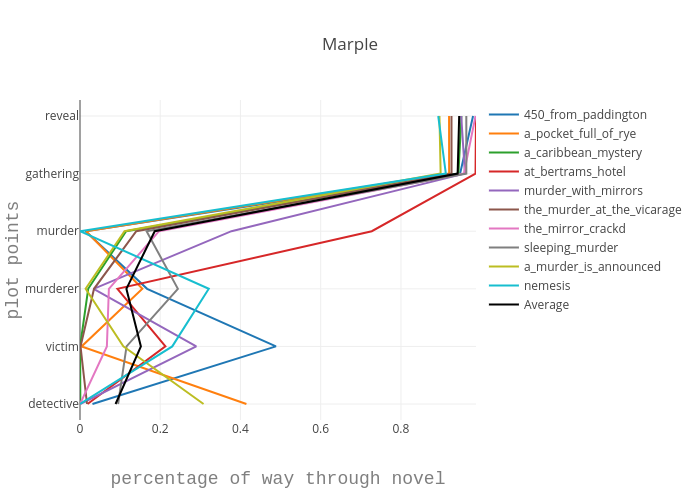
And here is the graph of the Marple novels. Again, you can click on it to explore it more thoroughly.
Results
The results were incredible – the Agatha Christie Formula clearly does exist. There’s a consistent pattern that Christie’s novels follow with almost remarkable precision, which is even more remarkable when you consider how much narrative diversity Christie achieved within the constraints of this formula. There’s a lot to be said about the literary implications of working within such a strict formula, and you can read more about my analysis of the results in the paper I wrote for this project, which is linked below. The paper discusses both the conclusions I drew from the formula and my thoughts on the outliers that deviated from the formula.
The breakdown of Poirot-only novels and Marple-only novels is fascinating in the context of gender differences between the two detectives. Again, you can read more in the attached paper. I discuss the gender-based explanations for subtle differences in the sub-formula for each detective, and how these differences relate to the social constraints of a female writer in the early- to mid-20th century.
If you’d like to read in more depth about this project, here is the paper I wrote about it (note: the paper was part of the final product for the class in which I did this project). It includes more details about my methods, and a thorough overview of my conclusions based on observations from the graphs.
* SPOILER ALERT – the murderers are introduced.
